A network of items
A visualisation of Martin Fowler's refactorings. For OO programmers, but also a general introduction to the capabilities of this software.
Add aspects, views, colours and filters to your data to gain insights
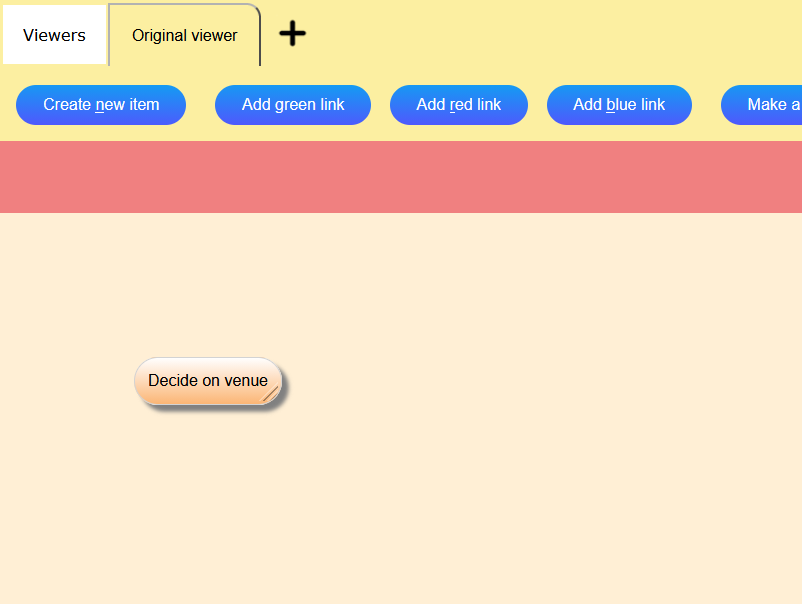
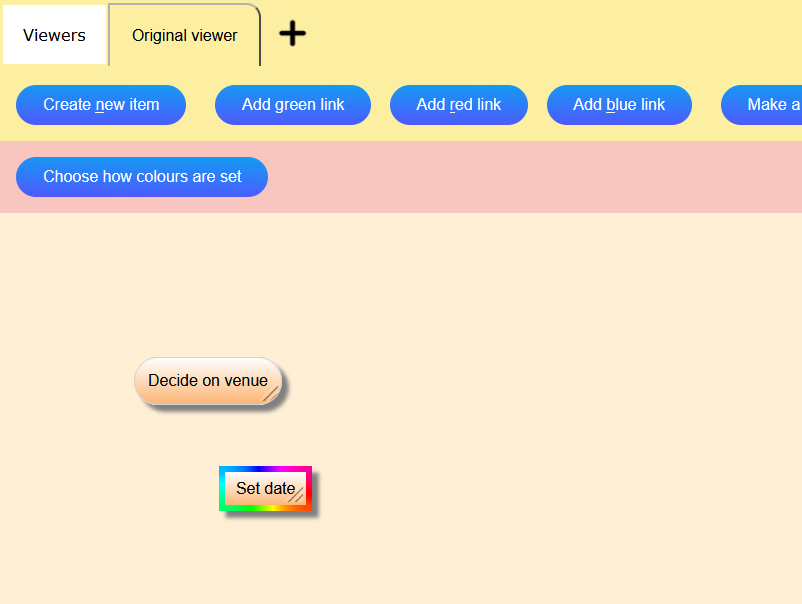
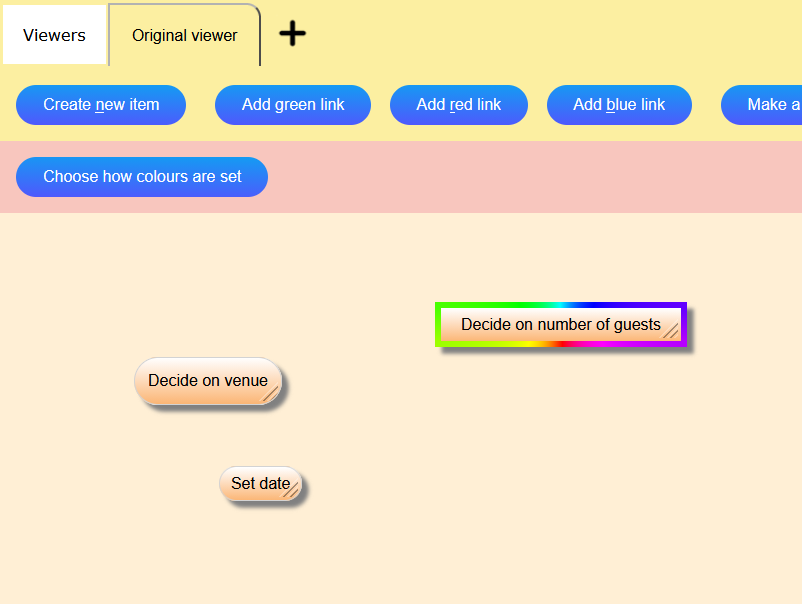
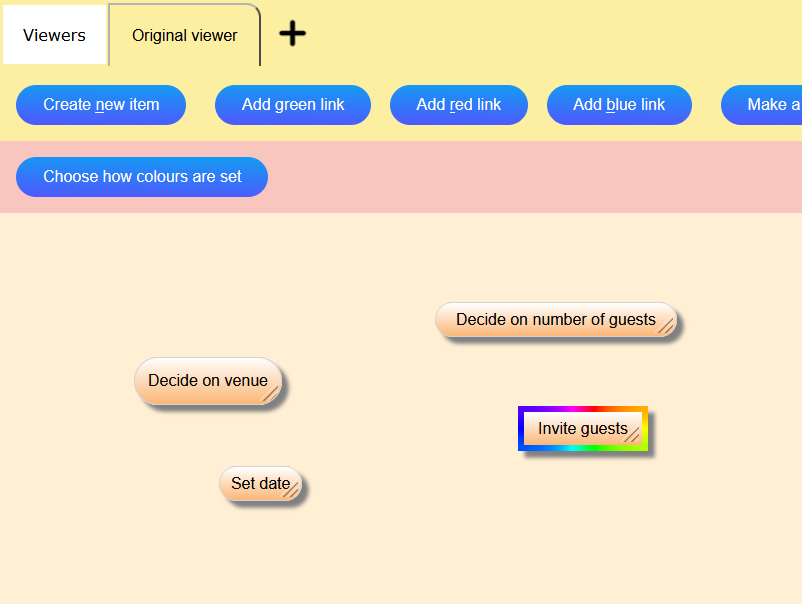
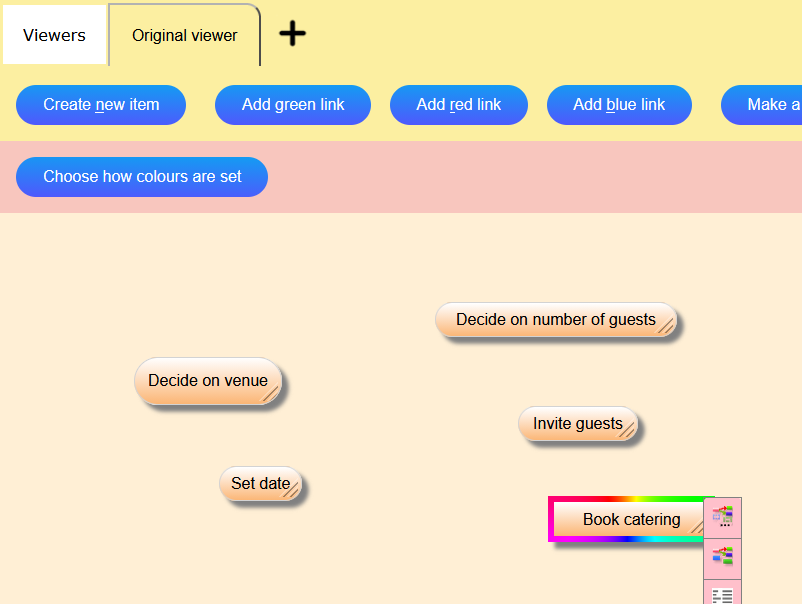
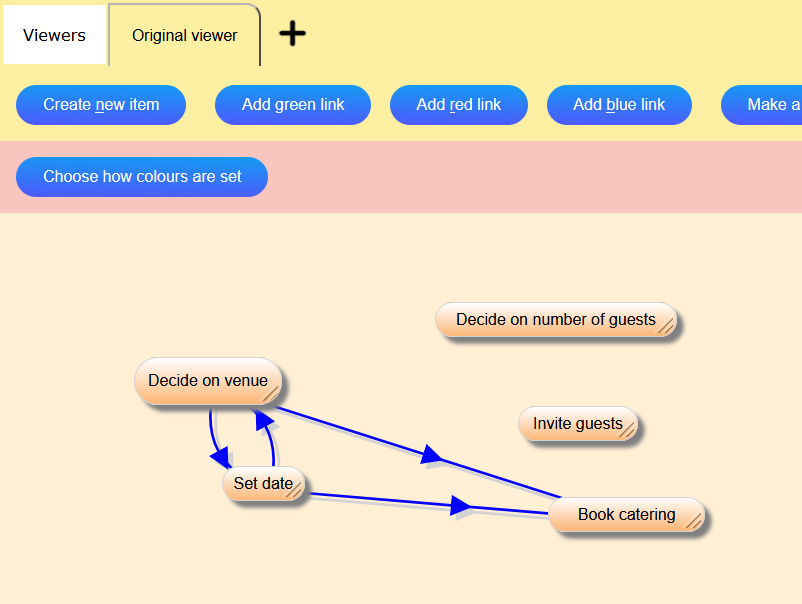
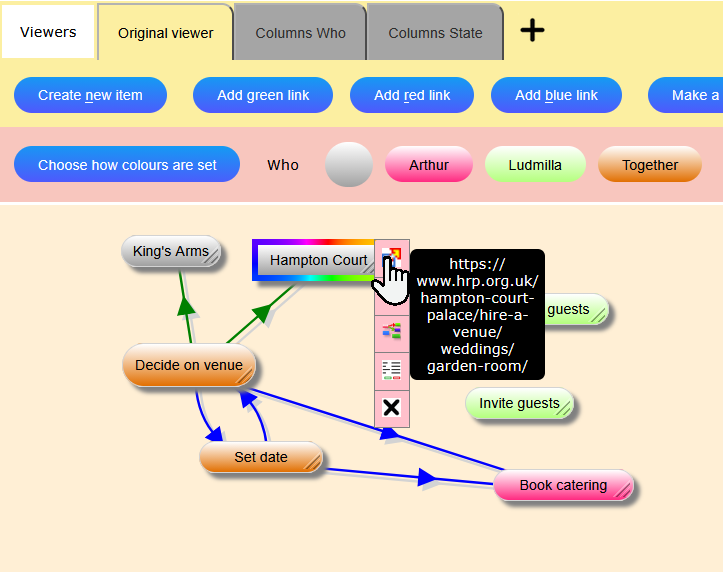
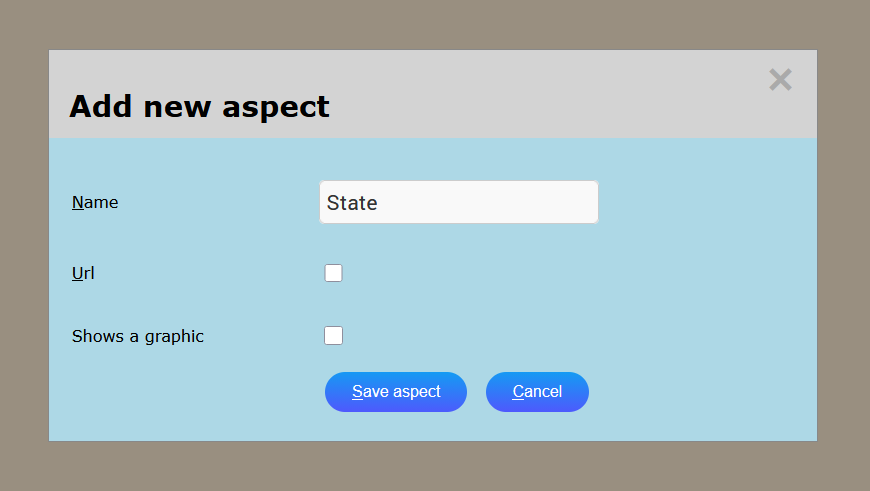
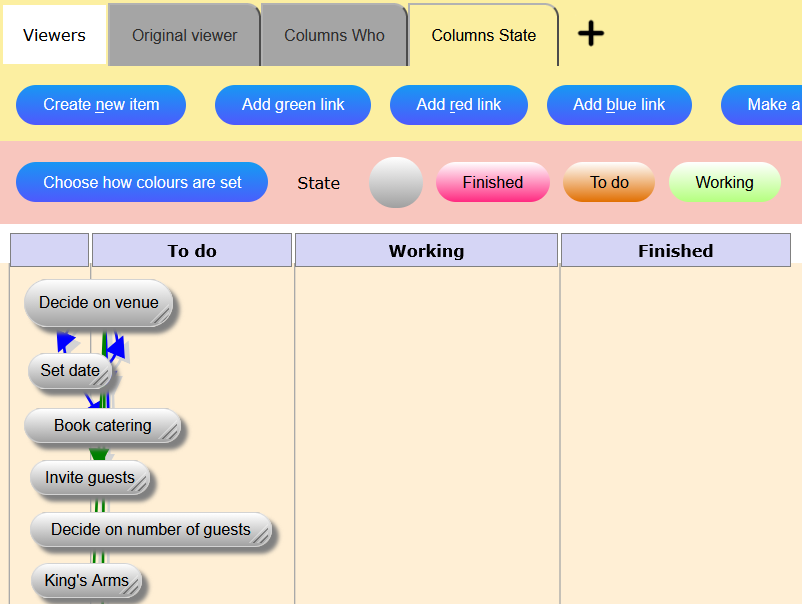
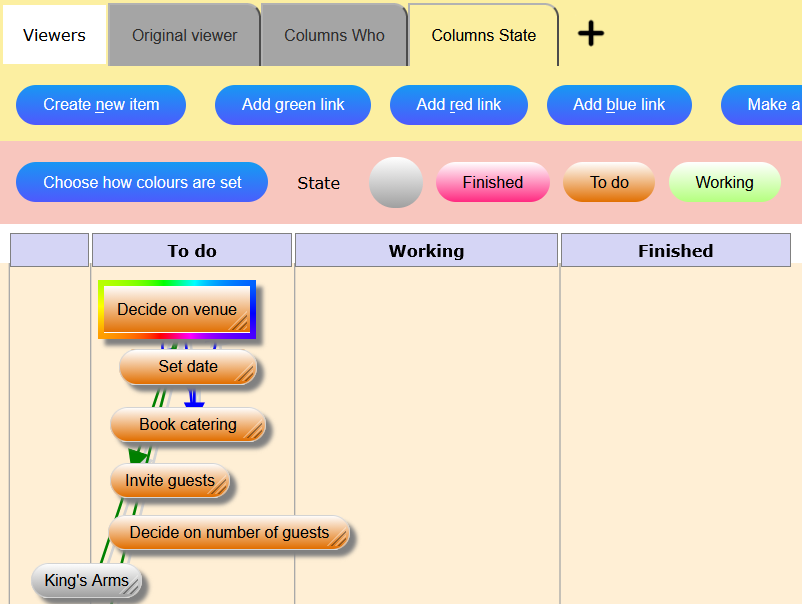
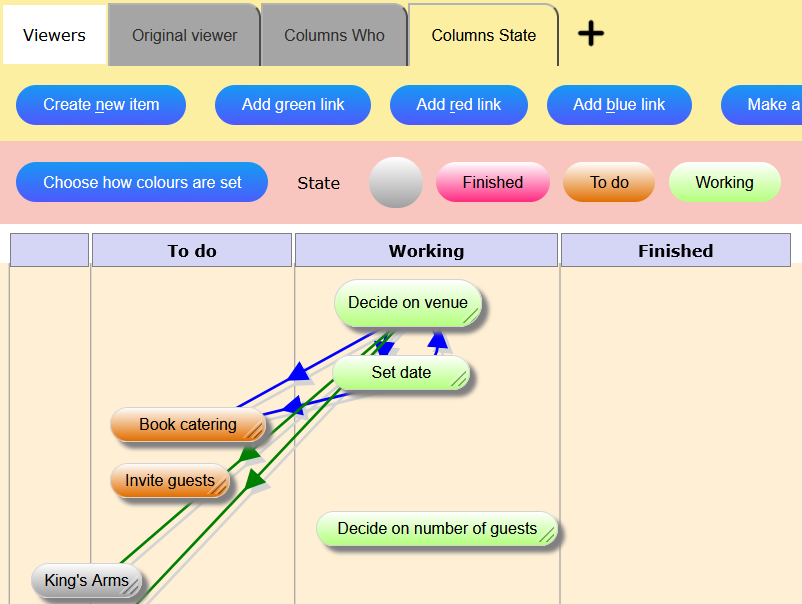
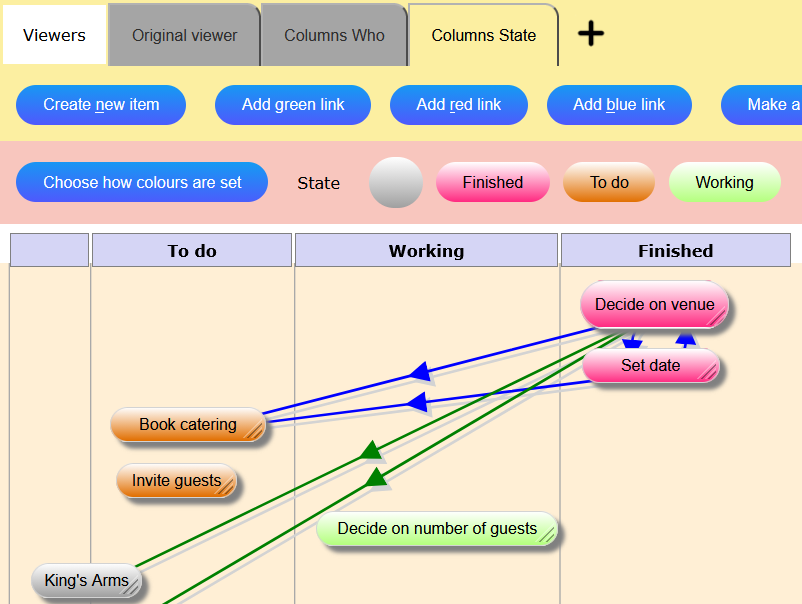
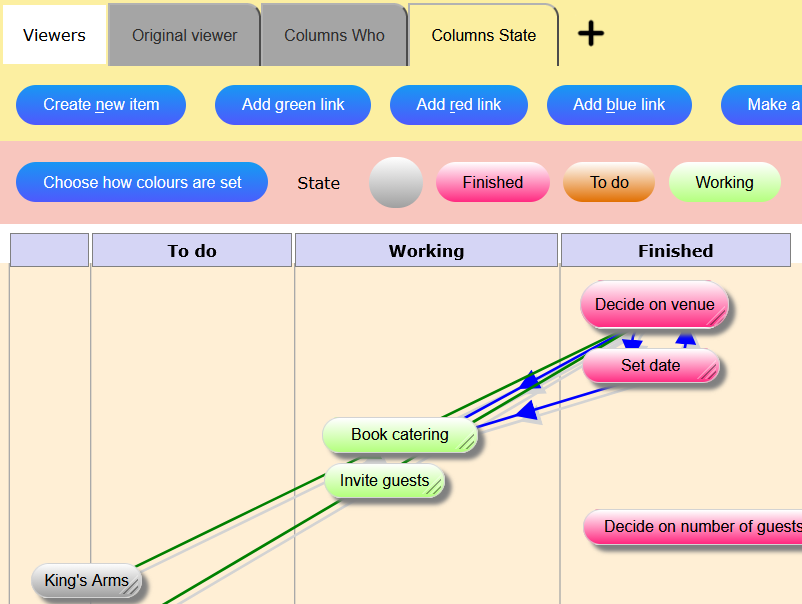
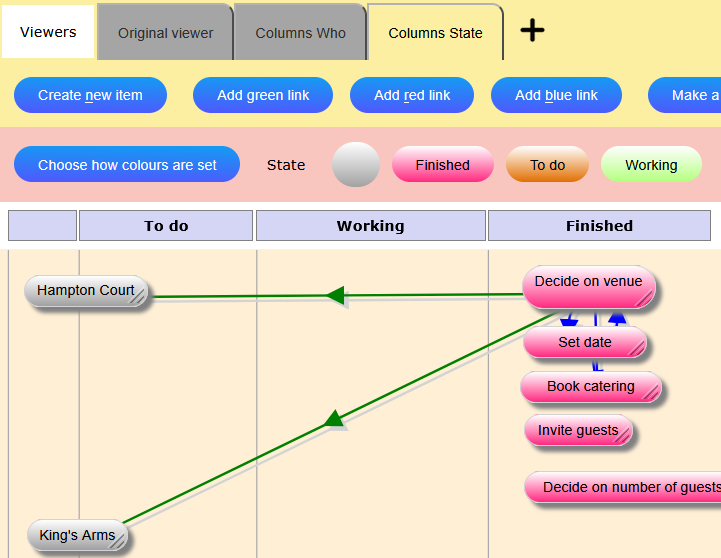
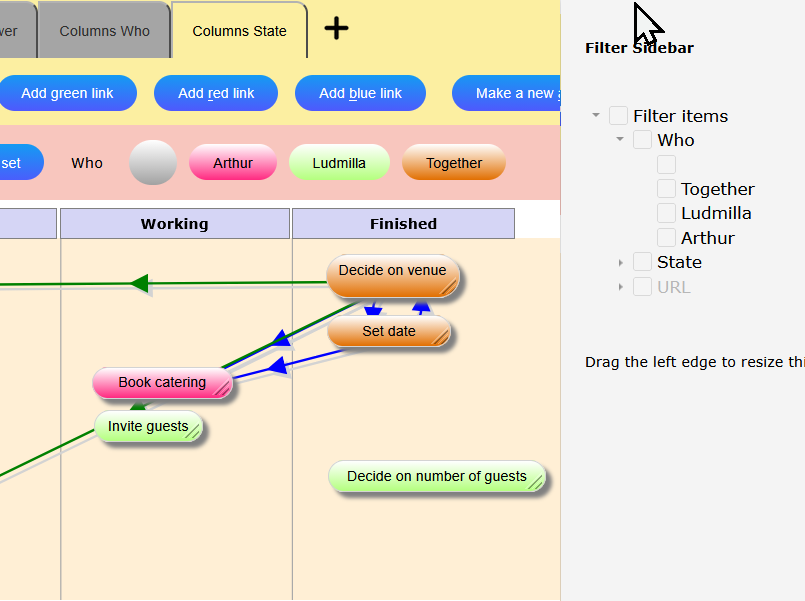
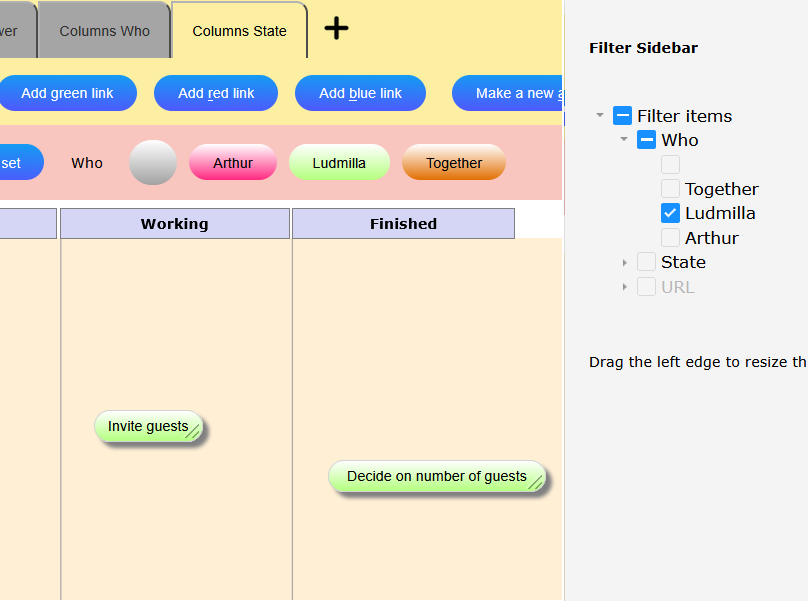
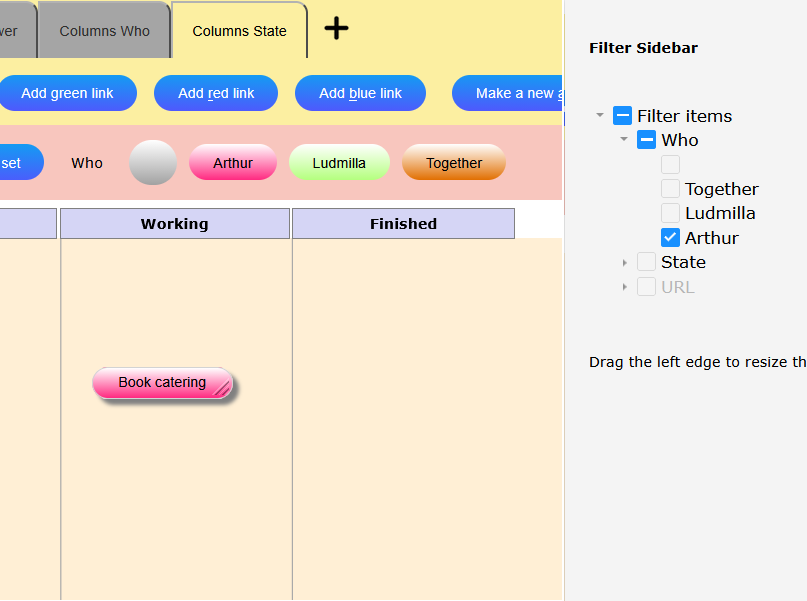

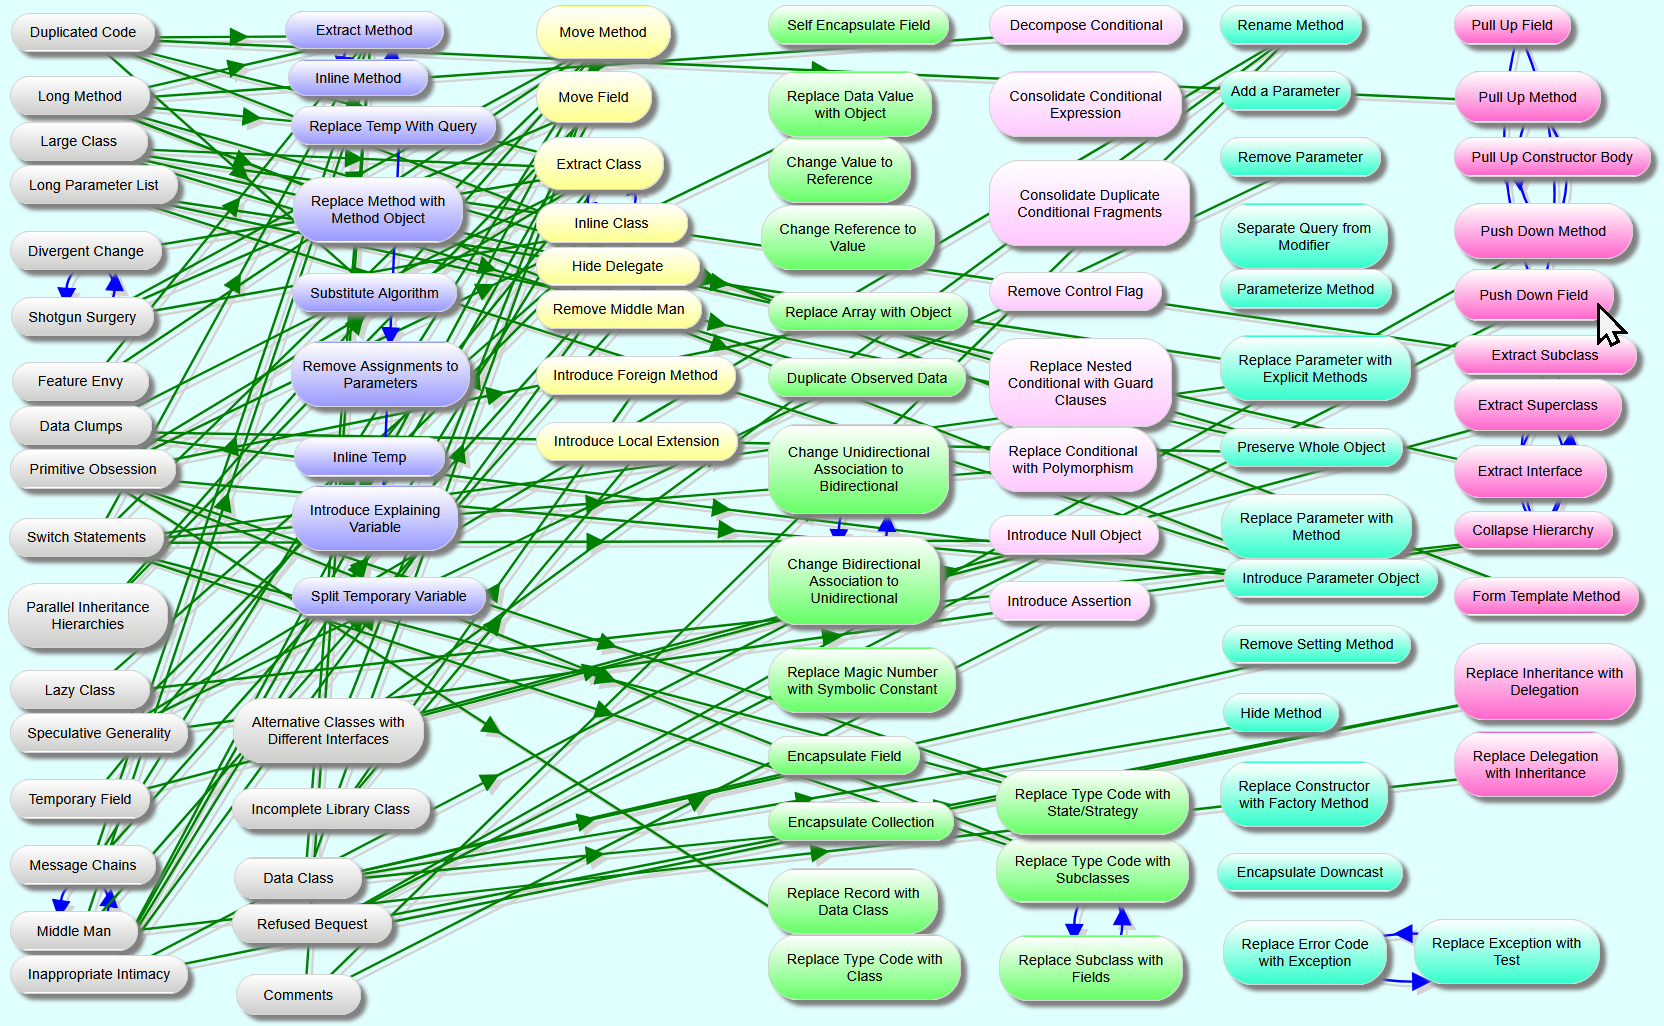
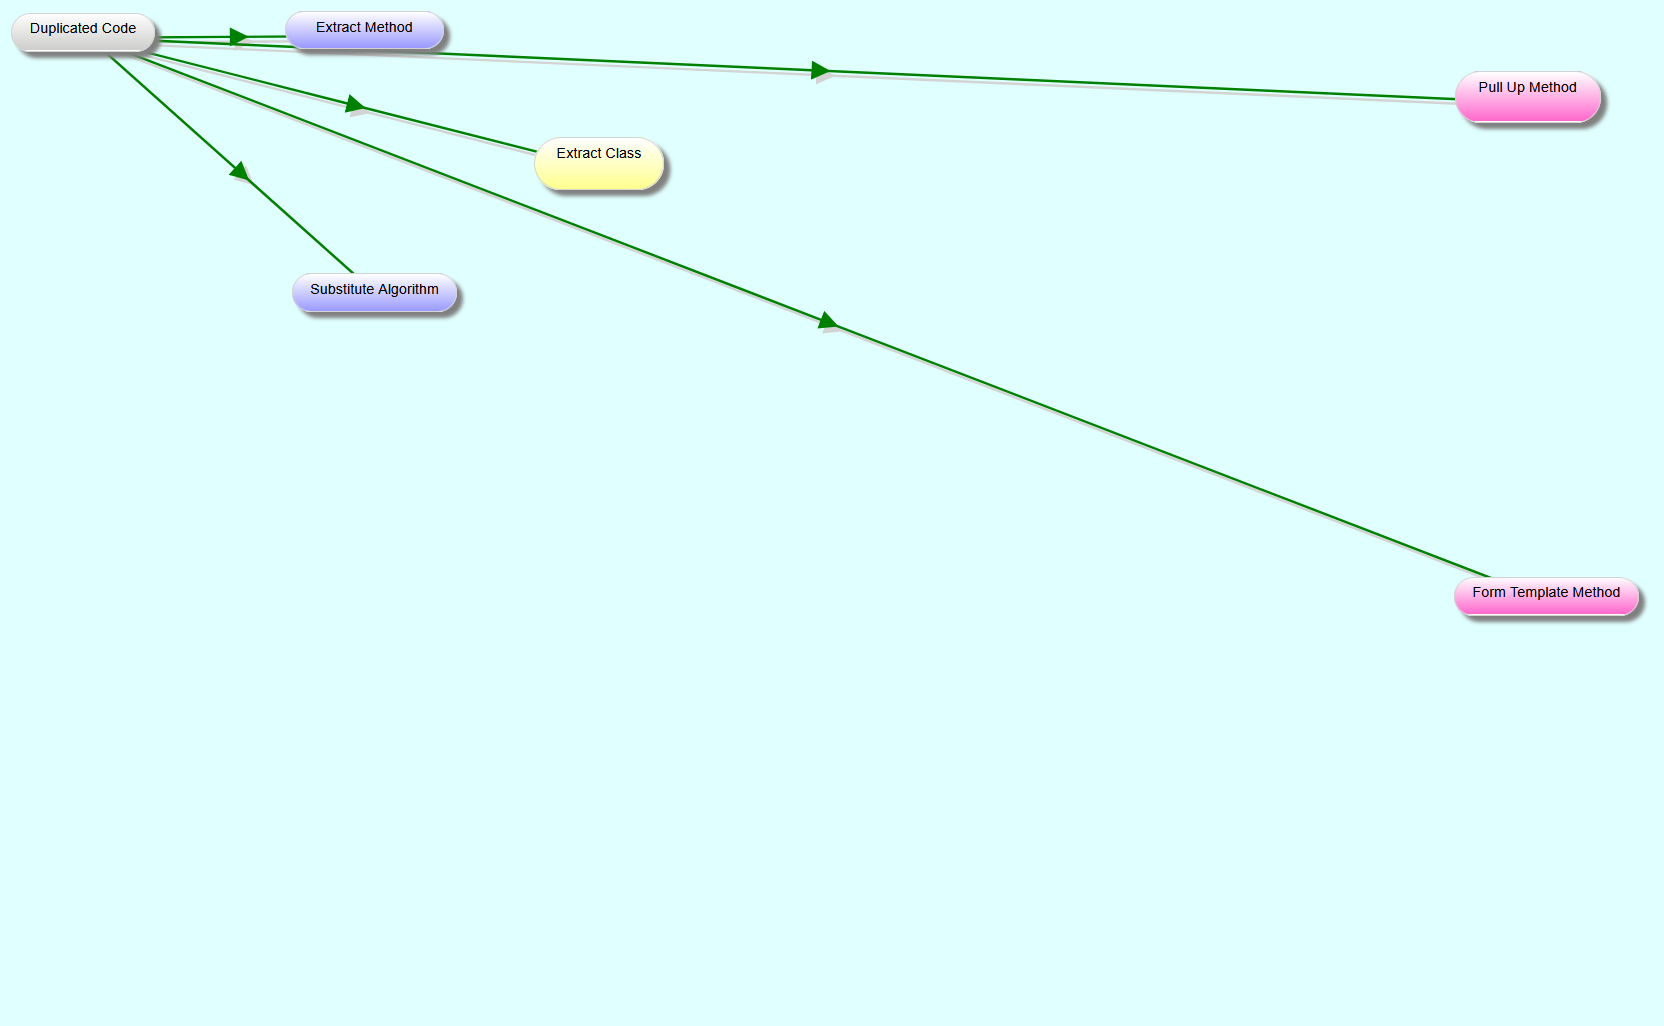
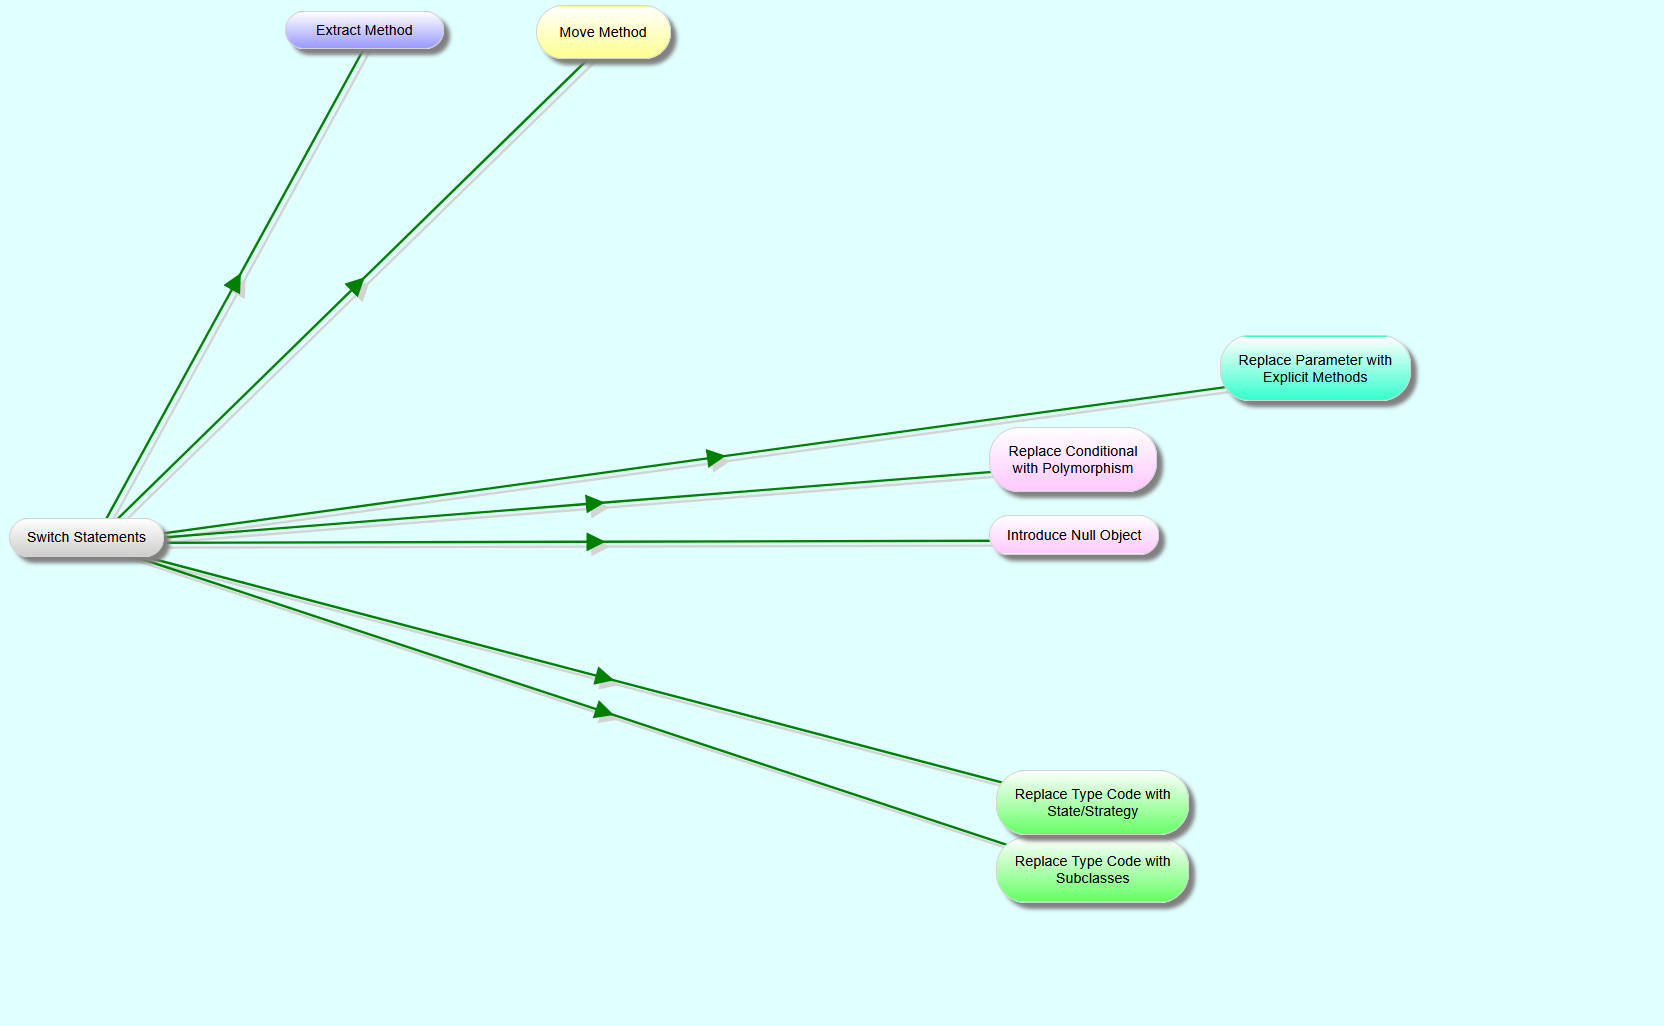
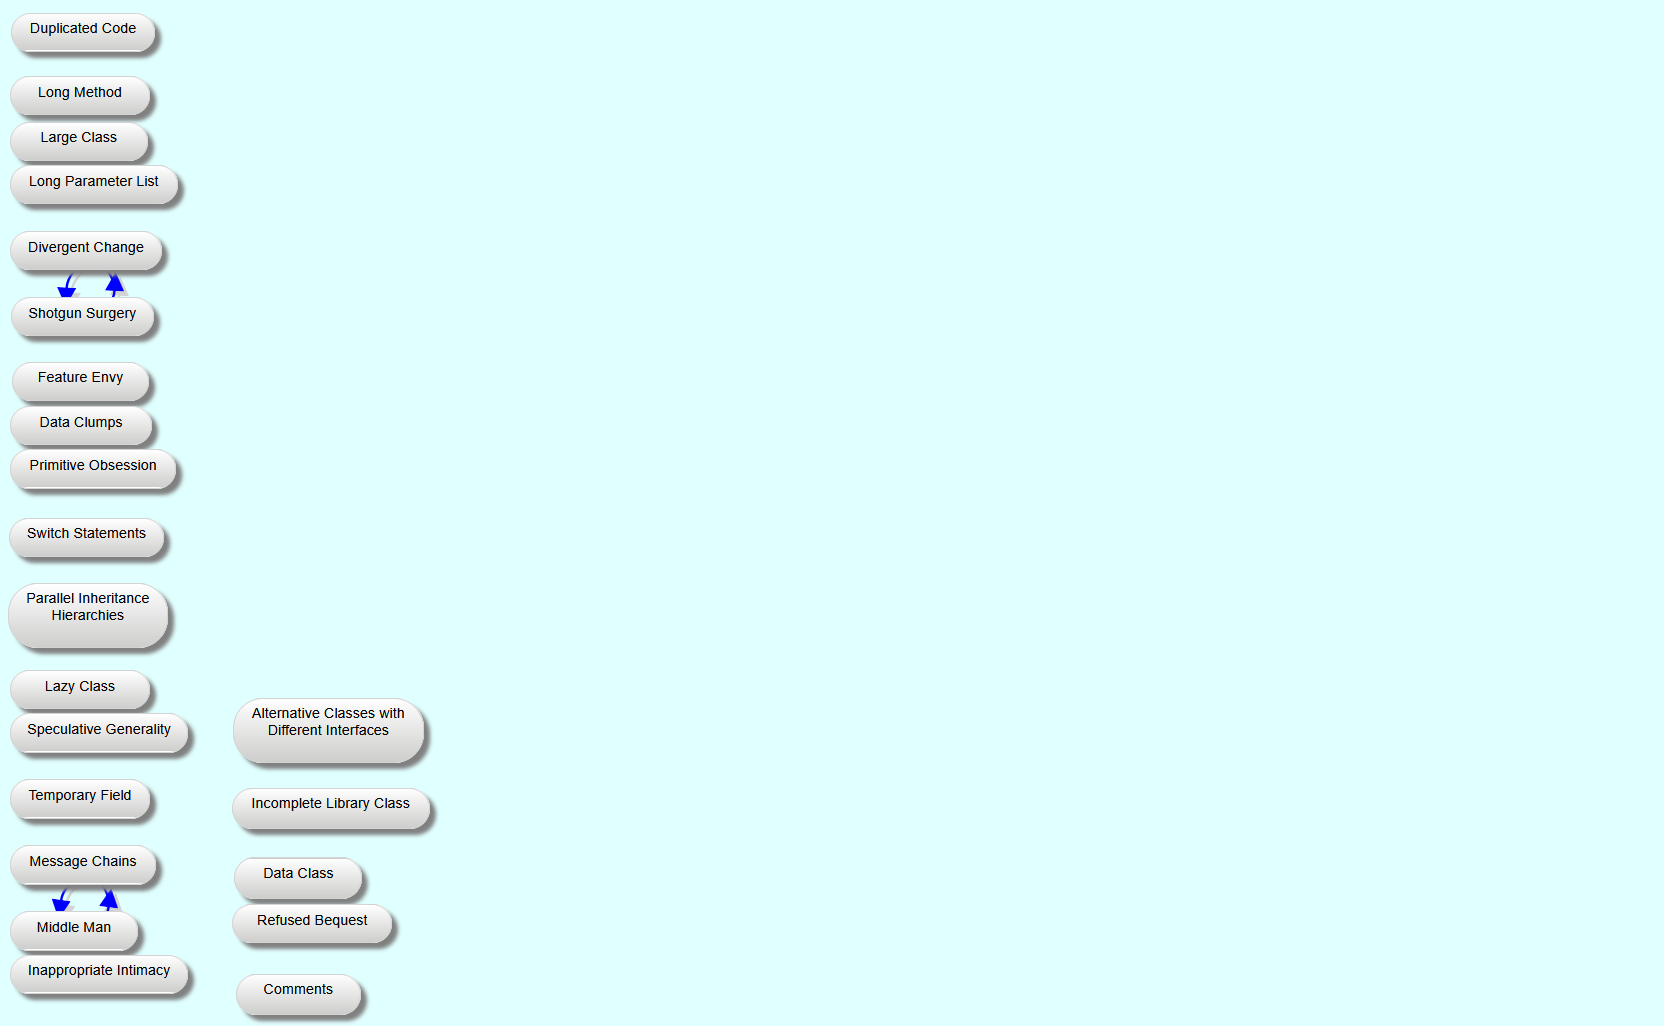
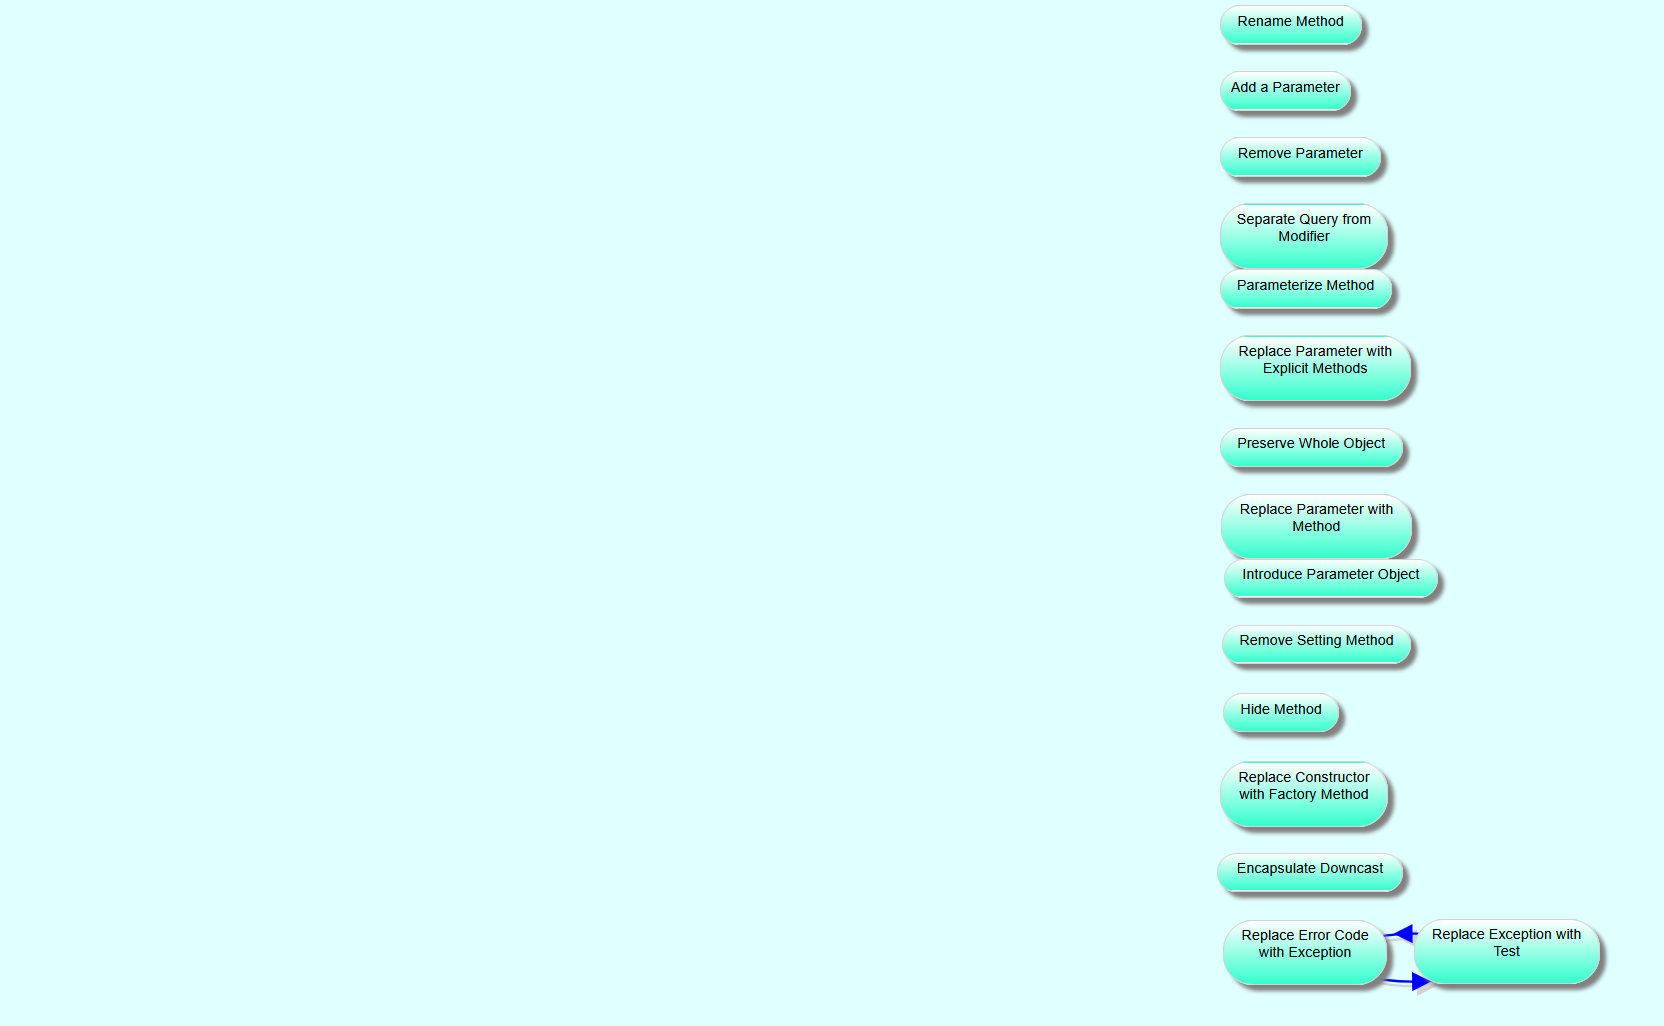
A visualisation of Martin Fowler's refactorings. For OO programmers, but also a general introduction to the capabilities of this software.
Diagrams of Romeo and Juliet showing various types of relationship.
For Java programmers: Java's collection classes and interfaces, showing inheritance, version updates, and more. Again, showcasing this app.